True Risk: Untangling Credit Risk from the Economy
Built a model to separate "how risky is this borrower" from "how bad was the economy when they borrowed" — then honestly tested whether real lending data can even support that separation, rather than reporting a confident number regardless.
The idea, in one sentence
Every credit scorecard trained on historical defaults quietly folds "the economy was bad that
year" into "this borrower is risky," because a model only sees who defaulted and when — not why.
This project tried to pull those two signals apart: an applicant-risk term (income, credit
score, debt load) and a macro-shock term (the actual U.S. unemployment rate, identical for every
loan alive at that moment), estimating one coefficient, β, for how much
a worse economy actually moves default odds, holding the borrower fixed.
Step 1: prove it on a case where the answer is already known
Before trusting the model on real, messy data, 40,000 synthetic loans were generated with
defaults driven by the real historical unemployment series, but with the true macro sensitivity
set by hand in advance to β = 0.45. The model was never told that
number. It recovered 0.4352 — within a rounding error of the truth — confirming the method
itself wasn't broken before it was ever pointed at a real borrower.
Step 2: real data, and the model returns an impossible number
Run on 1,322,289 real LendingClub loans (2007–2018), the model's answer to "how much does a worse economy raise default risk" came back negative — read literally, a recession making people less likely to default. Five increasingly sophisticated model variants, including a gradient-boosted model built specifically to rule out "the applicant side is too rigid," all kept the wrong sign.
The real cause: on LendingClub, the economic conditions a loan lived through are 96% correlated with the calendar month the loan was issued — the lender grew explosively and changed its own underwriting standards over exactly the years the economy was cycling through boom and bust. Two signals that are 96% the same signal cannot be cleanly separated by any model. That produced a falsifiable prediction, written down before testing it: a lender with decades of stable underwriting should break that entanglement and let the macro effect reappear, positive.
Step 3: a second dataset, and the prediction holds
Freddie Mac's mortgage data — underwriting rules largely unchanged for decades — was run through the identical procedure. The entanglement genuinely loosens, from LendingClub's 96% down to −0.175 at Freddie Mac's own vintage/macro correlation, landing close to where the known-good synthetic data sits. Once the macro window is widened to 48 months (mortgages don't default the month they're signed — the 2005–2007 vintages met their unemployment spike two to four years later), the macro effect comes back positive, across all five model variants.
Step 4: the twist — a positive sign is not the same as a positive number
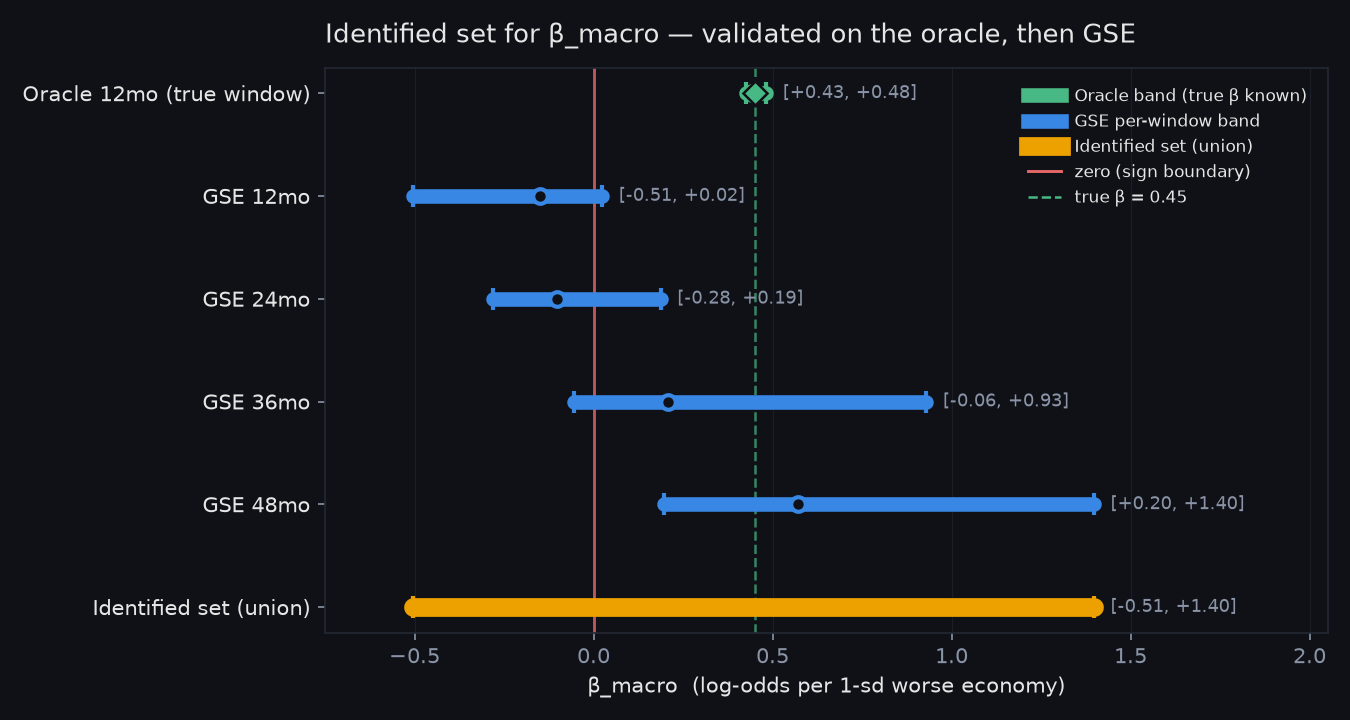
The 48-month window is a choice, not a fact handed down by the data, and that choice matters. On the synthetic data with a known answer, two standard model-selection rules (AIC and BIC) agree with each other almost exactly on which window to use. Applied to the real mortgage data, the same two rules disagree on the sign: one prefers 12 months and reports negative; the other prefers 48 months and reports positive. So instead of one confident coefficient, the honest deliverable is a range, whose ability to actually contain the truth was checked against the known-answer synthetic data first:
The identified set
On Freddie Mac's mortgage data, the true macro sensitivity could plausibly be anywhere in β ∈ [−0.50, +1.40] — a span that straddles zero entirely. An independent re-run on LendingClub gives a second range, [−1.18, +0.85], which also straddles zero and overlaps the mortgage range on [−0.51, +0.85]. Both datasets agree on what actually matters: the sign of the macro effect is not pinned down without first resolving a modeling choice the data itself doesn't settle.
Does data quality explain the wrong sign? A real pattern, then an honest null
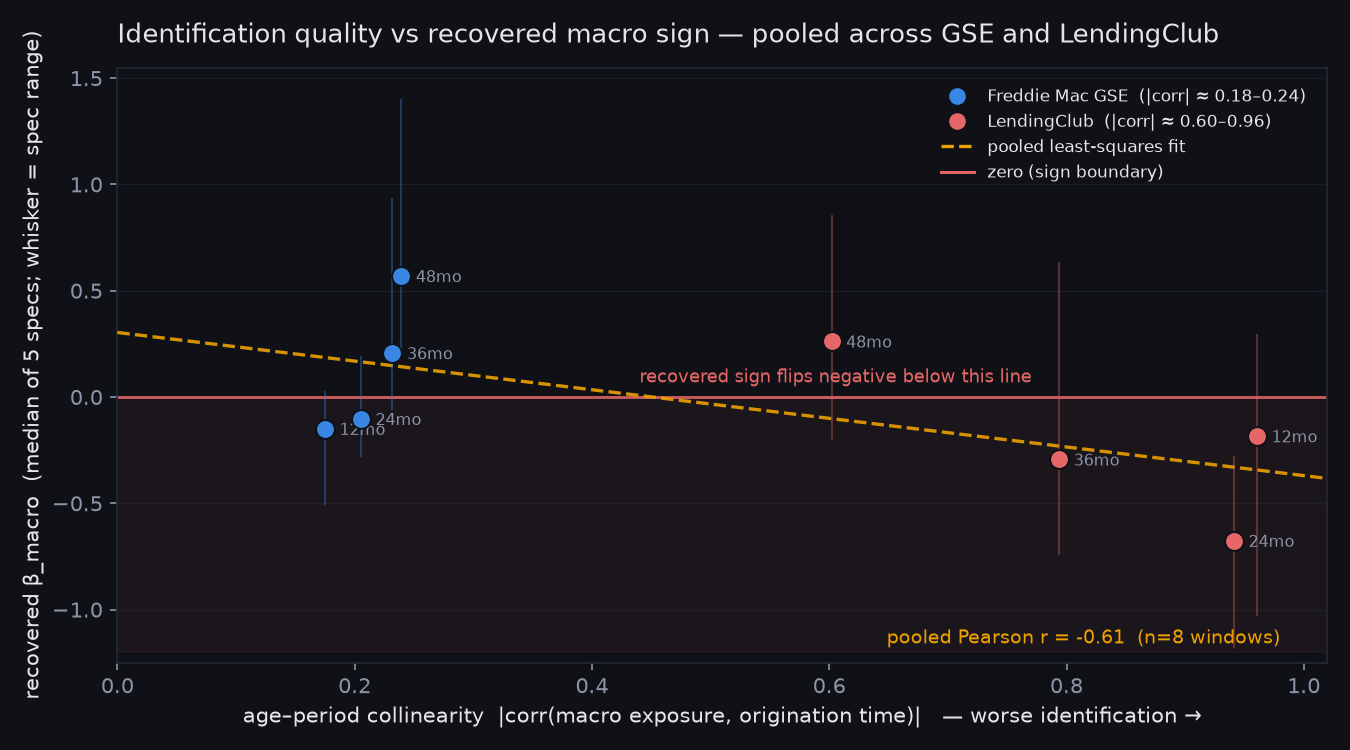
Pooling both real datasets, a clean pattern appears: the more entangled a dataset's macro exposure is with calendar time, the more negative its recovered sign tends to be. LendingClub's entanglement is 3.87× worse than Freddie Mac's, and most of its 20 model variants land negative (14 of 20), while Freddie Mac splits close to even (11 of 20 positive). Across all 40 estimates combined, that relationship holds up statistically (Pearson r = −0.462, p = 0.0027) — good enough to be a headline on its own, which is exactly why it was tested harder instead of reported at face value. Once the model controls for window length and which dataset a result came from, the "data quality predicts the sign" effect loses its statistical significance (coefficient −0.2941, p = 0.7081, confirmed by a 20,000-draw permutation test at p = 0.7016). Reporting that null instead of quietly keeping the better-looking raw correlation is the point.
Four different ways of measuring "the economy," one wall
A fair objection is that the fixed-window average itself might be the bug. Four structurally different ways of representing macro exposure were built — dropping the window for a per-month exposure, letting the effect decay gradually instead of cutting off sharply, letting a recession hit low-credit-score borrowers harder, and giving loan prepayment its own macro sensitivity — each first checked against the known-answer synthetic data, the same discipline as Step 1. None resolved the sign; every one hit the same LendingClub vintage/economy entanglement from Step 2, just reached a different way. That consistency across four independent model designs is stronger evidence the wall is real than any single model landing on a negative number would have been.
What we'd do differently
Four structural weaknesses are worth naming plainly: the macro window is a flat average whose length is a free parameter that can flip the sign; the model assumes a recession affects every borrower identically regardless of credit profile; a loan paid off early looks identical to one still healthy, so the prepayment channel is invisible; and the economy is represented by one number (national unemployment) with no house prices, mortgage rates, or local labor markets. Two of these were actually built and tested, not just flagged — a decaying-weight exposure got the disagreeing AIC/BIC rules to finally agree with each other on both datasets, and testing whether a recession hits low-credit-score borrowers harder turned up a statistically significant effect on both real datasets, but with opposite signs between them — itself a symptom of the same entanglement problem, not a real shared pattern.
The actual point
The interesting finding here isn't a coefficient. It's the discipline of checking whether the data can support a claim before trusting it: prove the method on a known answer first; when real data gives a wrong answer, trace it to a specific, nameable cause instead of waving it away; turn that diagnosis into a falsifiable prediction and check it against independent data; report a range whose coverage was validated against a known answer, not a confident point estimate with the wrong kind of uncertainty; and when a good-looking correlation shows up, push it harder because it looks good, and keep the less flattering result that survives.
Reproducibility
Every number on this page is quoted or paraphrased directly from the project's own
ARTICLE.md and docs/WRITEUP.md, both checked
against the underlying result files by automated linters. The project's own
reproduce.sh regenerates every figure and number from a clean clone with
pinned dependencies, running 5 oracle re-checks, 5 consistency linters, and 20 test files —
verified byte-identical across separate clean-room runs.